 Viktors Nikolajevs
Article contents
Across the 12 member states updated through July, 202,597 BEVs were registered during the month, up 41.8% year on year. BEVs accounted for 26.3% of new passenger-car registrations across those reporting countries.
Publicly accessible charging infrastructure across the EU27 reached 1,157,551 points, 15.2% higher than in July 2025.
The July vehicle figure is not a full EU27 total
EAFO currently has July registration data for Belgium, Czech Republic, Denmark, Finland, France, Germany, Ireland, Italy, Luxembourg, the Netherlands, Spain and Sweden.
The remaining EU member states are still updated through June. The 202,597 figure should be treated as a preliminary total for the 12 reporting countries rather than a synchronised July figure for all 27 member states.
Germany and France lead the updated markets
Germany recorded the largest July BEV volume among the reporting countries, with 78,609 registrations. France followed with 44,378.
France recorded the strongest year-on-year growth at 127.1%, while all 12 reporting markets recorded higher BEV registrations than a year earlier.
UK July growth was slightly higher
For comparison, SMMT recorded 43,106 BEV registrations in the UK during July, up 44.5% year on year and representing 27.5% of the new-car market.
That puts UK July BEV growth slightly above the 41.8% recorded across the 12 EU markets currently reporting July data, although the two datasets cover different market sizes and should not be treated as directly equivalent.
UK public charging also continued to grow during the same period, but at a lower annual rate of 9.5% than the EU-wide 15.2% figure.
Vehicle growth and charger growth cannot be compared one-for-one
The difference between BEV registration growth and public-charger growth is worth tracking, but it does not prove that charging infrastructure is falling behind.
Vehicle registrations measure new vehicles entering the parc, while charger totals measure an accumulated installed network. Home and workplace charging, charger utilisation, power rating and geographic distribution all affect the amount of infrastructure actually required.
A more useful long-term comparison will combine charger count with installed charging power, utilisation and the size of the BEV parc rather than relying on device numbers alone.
Related articles
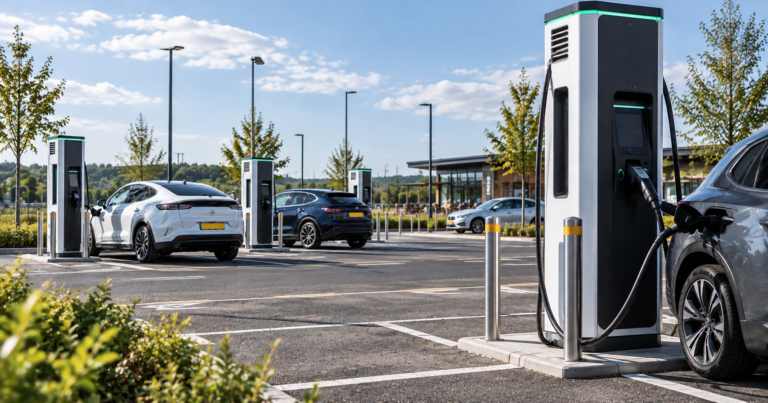
UK reaches 121,171 public EV chargers as rapid network grows faster
Department for Transport figures show the UK had 121,171 publicly available EV chargers, measured as EVSE, on 1 July 2026. Of these, 28,887 were…
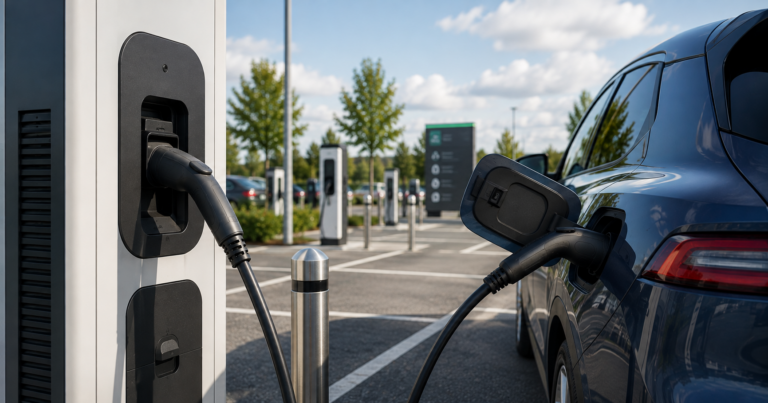
UK rapid-charging tariff spread reaches roughly 39p-93p/kWh
UK rapid and ultra-rapid public charging prices now span roughly 39p/kWh to 93p/kWh across selected tariffs in Chargenet's 11 September comparison, illustrating how difficult…
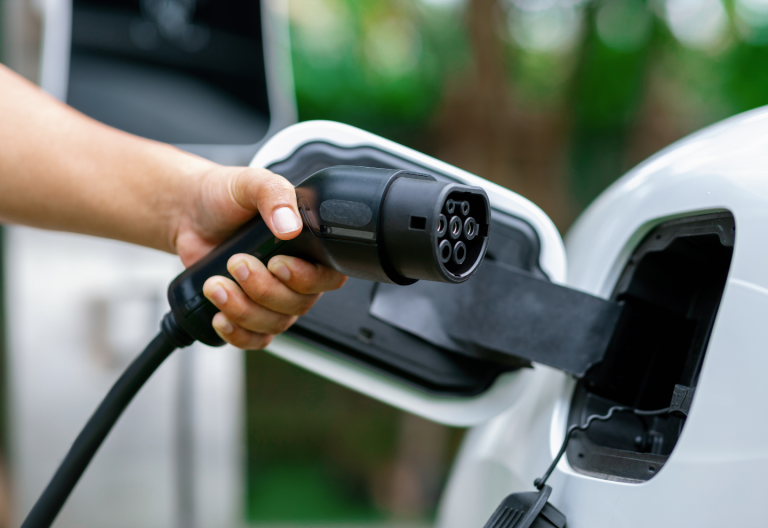
More than 90% of UK councils have public charging, but on-street gap remains
More than 90% of UK councils have at least one public EV charger within their area, but only 39% report on-street charging provision, according…