 Viktors Nikolajevs
Article contents
Taken together, the figures show plug-in vehicles taking a larger share of new registrations while the public charging network continues to expand. They also show why the total number of chargers is becoming a less useful measure on its own.
At the end of July, the UK had 122,724 public EV chargers. The network added a net 1,553 chargers during the month and was 9.5% larger than a year earlier.
During the same month, 43,106 battery electric cars and 23,359 plug-in hybrids were registered. Combined, cars that can be plugged in accounted for 42.5% of the new-car market.
Editor note
DfT faster indicators are timelier datasets published by the Department for Transport to provide an early view of developing trends before the corresponding full official statistics become available. They currently include monthly public EV charging infrastructure data and provisional estimates of new car and light commercial vehicle registrations.
For vehicle registrations, DfT combines DVLA registration data with monthly SMMT data to estimate the most recent months. These figures are provisional and may differ slightly from the final official statistics once complete DVLA data becomes available.
Plug-in cars are close to petrol and diesel combined
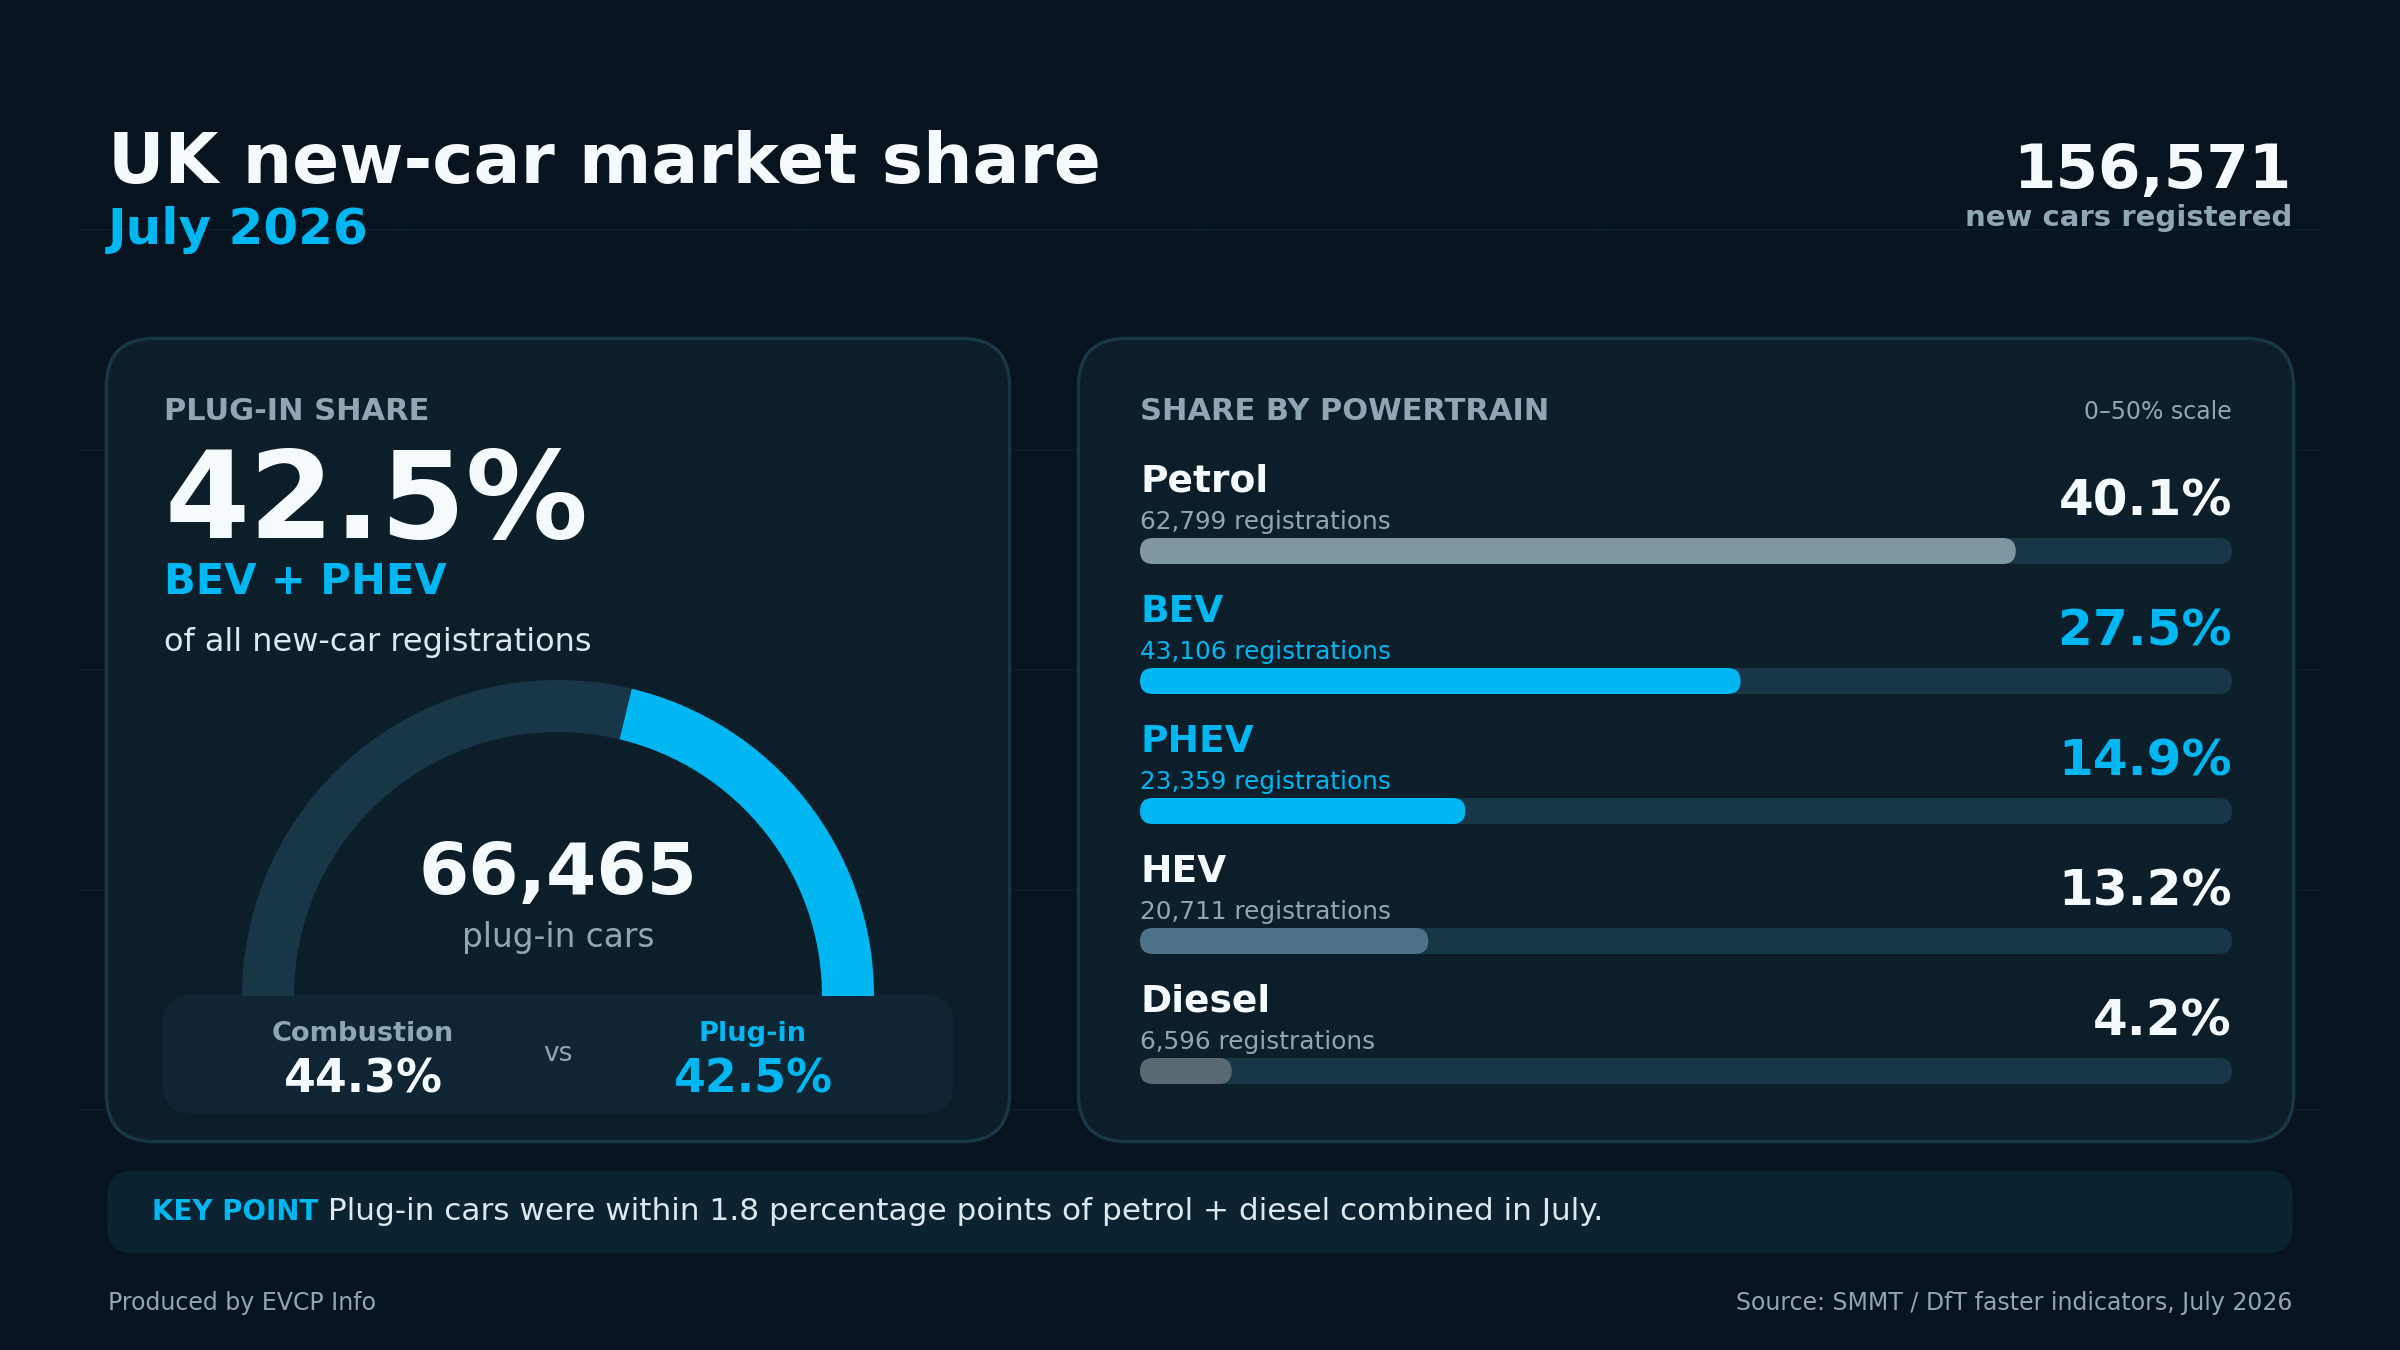
July was a strong month for plug-in cars. Battery electric vehicle registrations reached 43,106, up 44.5% compared with July 2025, giving BEVs a 27.5% share of new-car registrations.
A further 23,359 plug-in hybrids were registered, up 33.6%, taking a 14.9% share. Together, BEVs and PHEVs accounted for 66,465 registrations, or 42.5% of the market.
Petrol cars accounted for 40.1% and diesel for 4.2%. Combined, petrol and diesel represented 44.3% of July registrations.
That puts plug-in cars very close to petrol and diesel combined. Conventional hybrids added another 13.2% of registrations, but they do not plug in and therefore do not directly add demand for charging infrastructure.
July’s 44.5% BEV increase needs some context
The 44.5% year-on-year increase in BEV registrations is a strong result, but July 2025 provides a relatively low comparison. SMMT described that month as subdued, with some buyers delaying purchases while waiting for confirmation of vehicle eligibility under the Electric Car Grant.
The year-to-date figures provide a better indication of the underlying market. Between January and July, 327,683 BEV cars were registered, up 28.7% from the same period in 2025. BEVs account for 25.3% of new-car registrations so far this year.
PHEV growth has been stronger again, with 171,491 registrations, up 37.7%, and a year-to-date share of 13.25%.
Together, 499,174 plug-in cars were registered during the first seven months of 2026, representing 38.6% of the new-car market. That is still a substantial increase, even if July alone makes the rate of change look more dramatic.
The public charging network added another 1,553 chargers
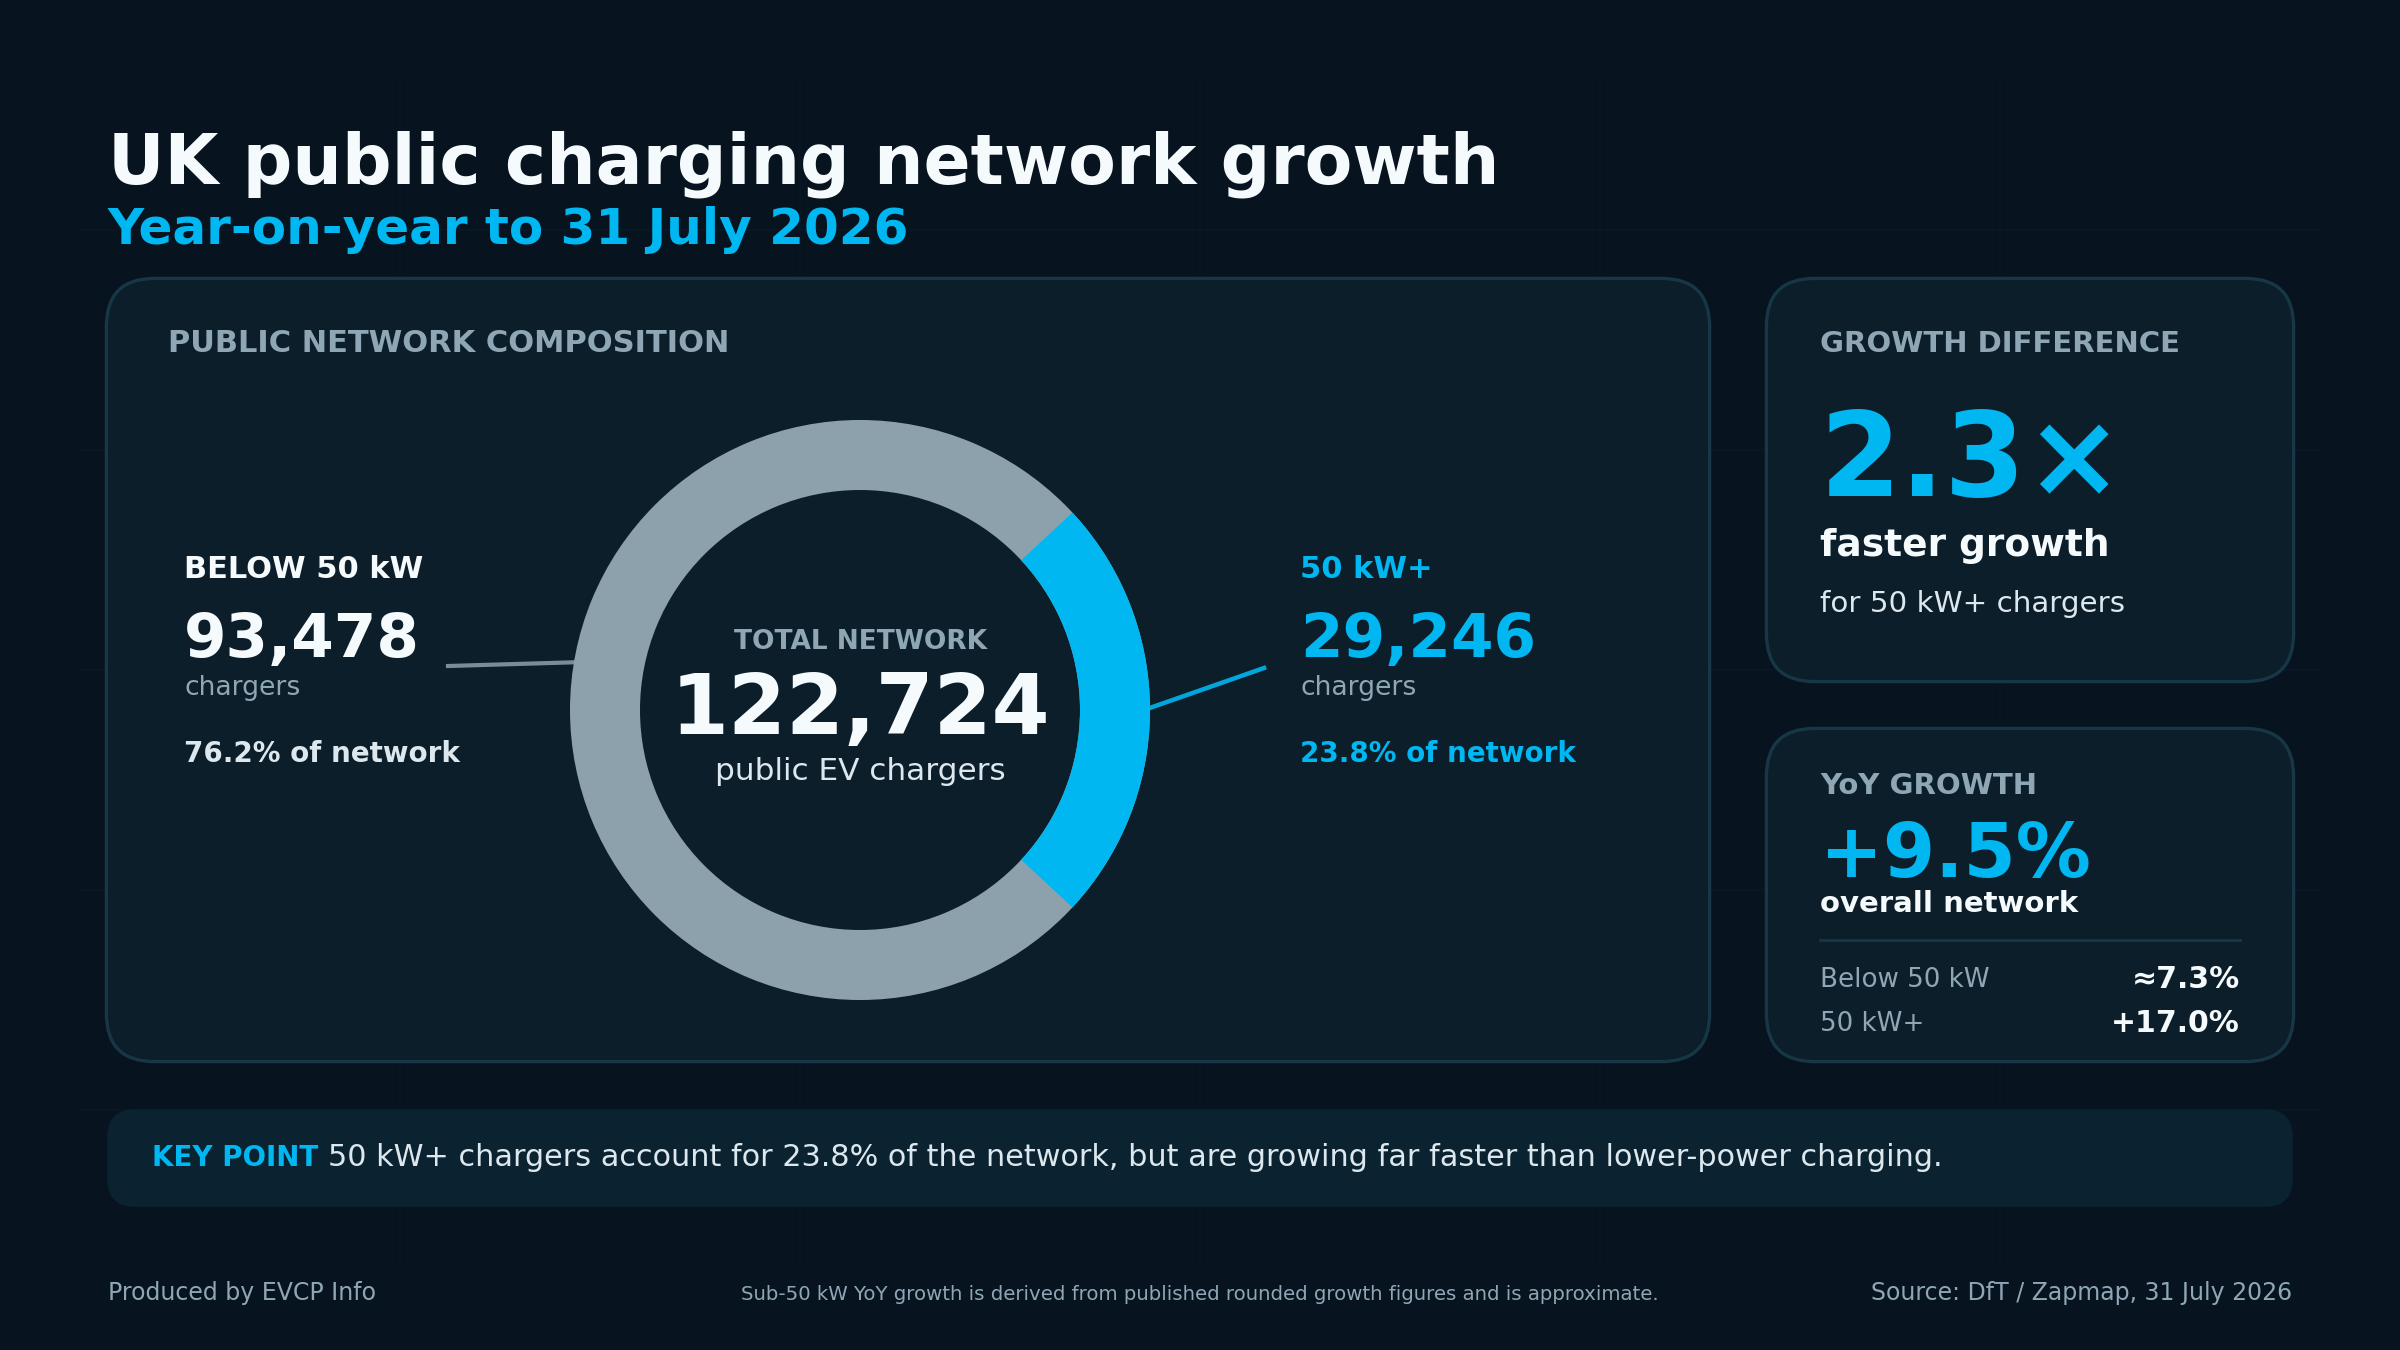
The public charging network reached 122,724 chargers at the end of July, following a net increase of 1,553 during the month. The network is now 9.5% larger than it was a year ago.
These figures refer to EV chargers, or EVSE, rather than physical charging devices. DfT changed its headline measure from devices to chargers from 2026.
An EVSE is the independently controlled part of a charging device that normally allows one vehicle to charge at a time. A physical unit can therefore contain more than one EVSE. DfT considers EVSE count a better indication of how many vehicles the infrastructure can normally support at the same time than simply counting cabinets or pedestals.
That change is important when comparing current figures with older DfT statistics, which often used physical charging devices as the main headline number.
Higher-power charging is growing faster than the network overall
The higher-power part of the network continues to grow faster than the overall public charger count.
There were 29,246 public chargers rated at 50 kW or above at the end of July. That is 17% more than a year earlier, compared with 9.5% growth across the whole public network. A net 359 rapid and ultra-rapid chargers were added during July.
This matters because a charger count does not show how much charging capacity has actually been added. A 7 kW on-street charger and a 350 kW ultra-rapid charger each add one EVSE to the national total, but they perform very different jobs.
Rapid and ultra-rapid chargers represent about 24% of public EVSE, but Zapmap estimates that they provide around 60% of the public network’s total charging capacity.
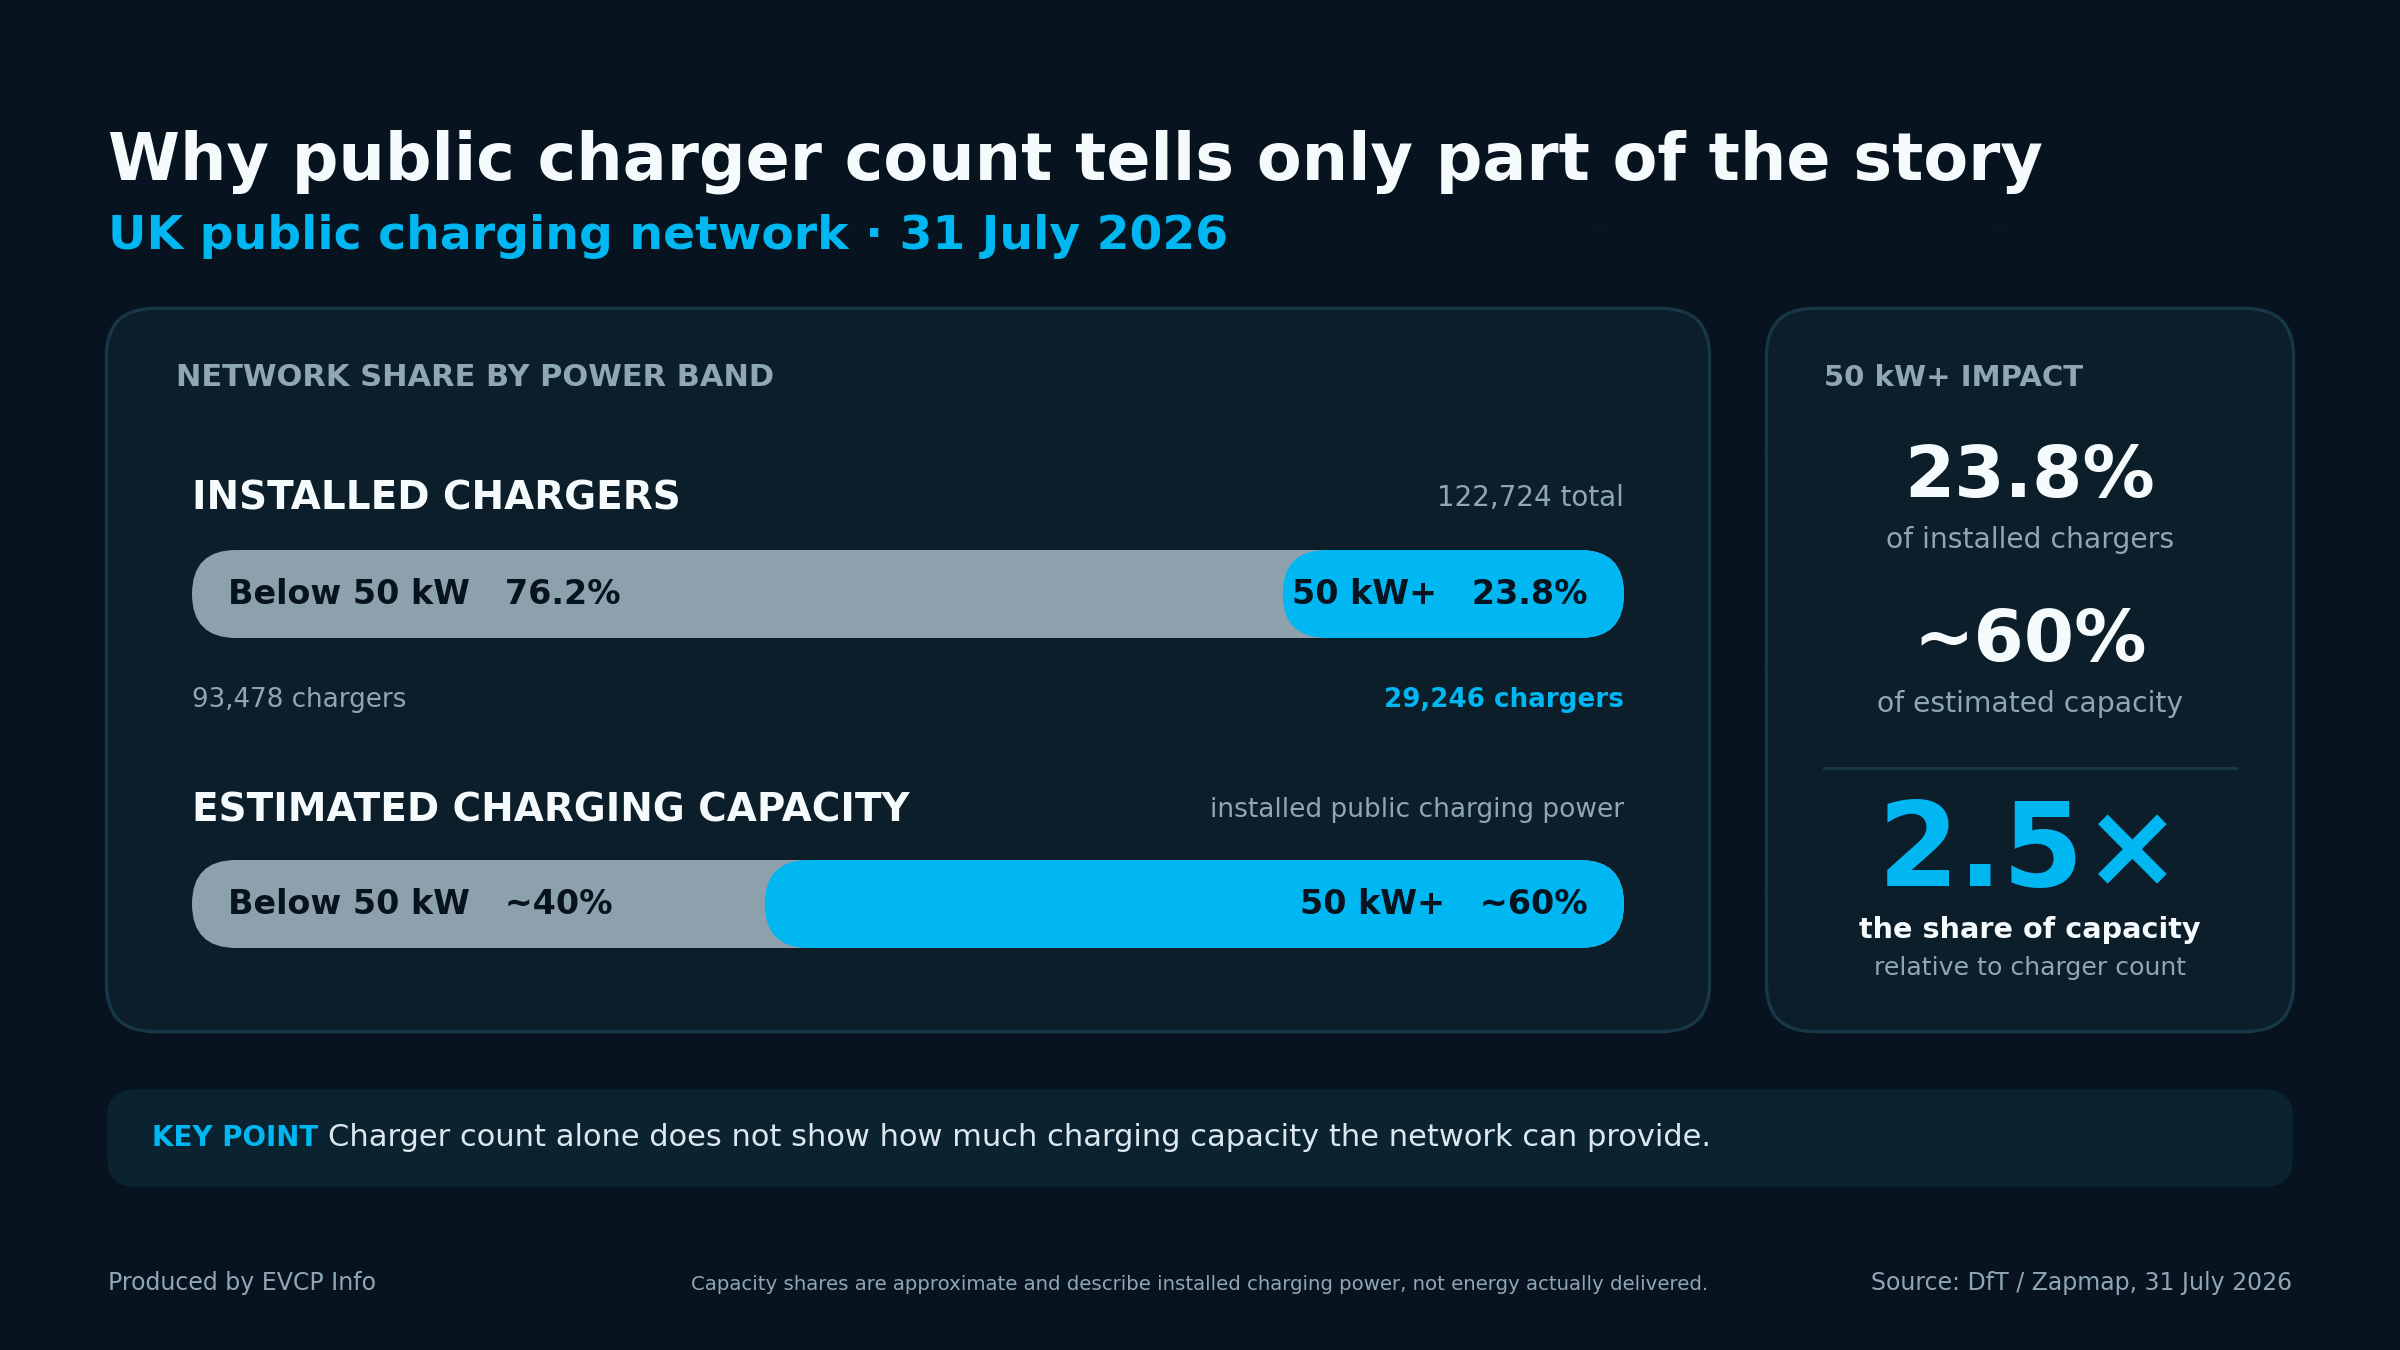
Lower-powered infrastructure remains important, particularly for residential streets, workplaces and destinations where vehicles remain parked for longer. The point is not that one type is better than another. It is that the national EVSE total combines infrastructure serving very different use cases.
Editor note
Since 2026, DfT has used individual EV chargers/EVSE rather than physical charging devices as its headline public-charging measure, so current totals are not directly comparable with older device counts.
Electric van registrations are beginning to move
July also produced a notable result for electric light commercial vehicles.
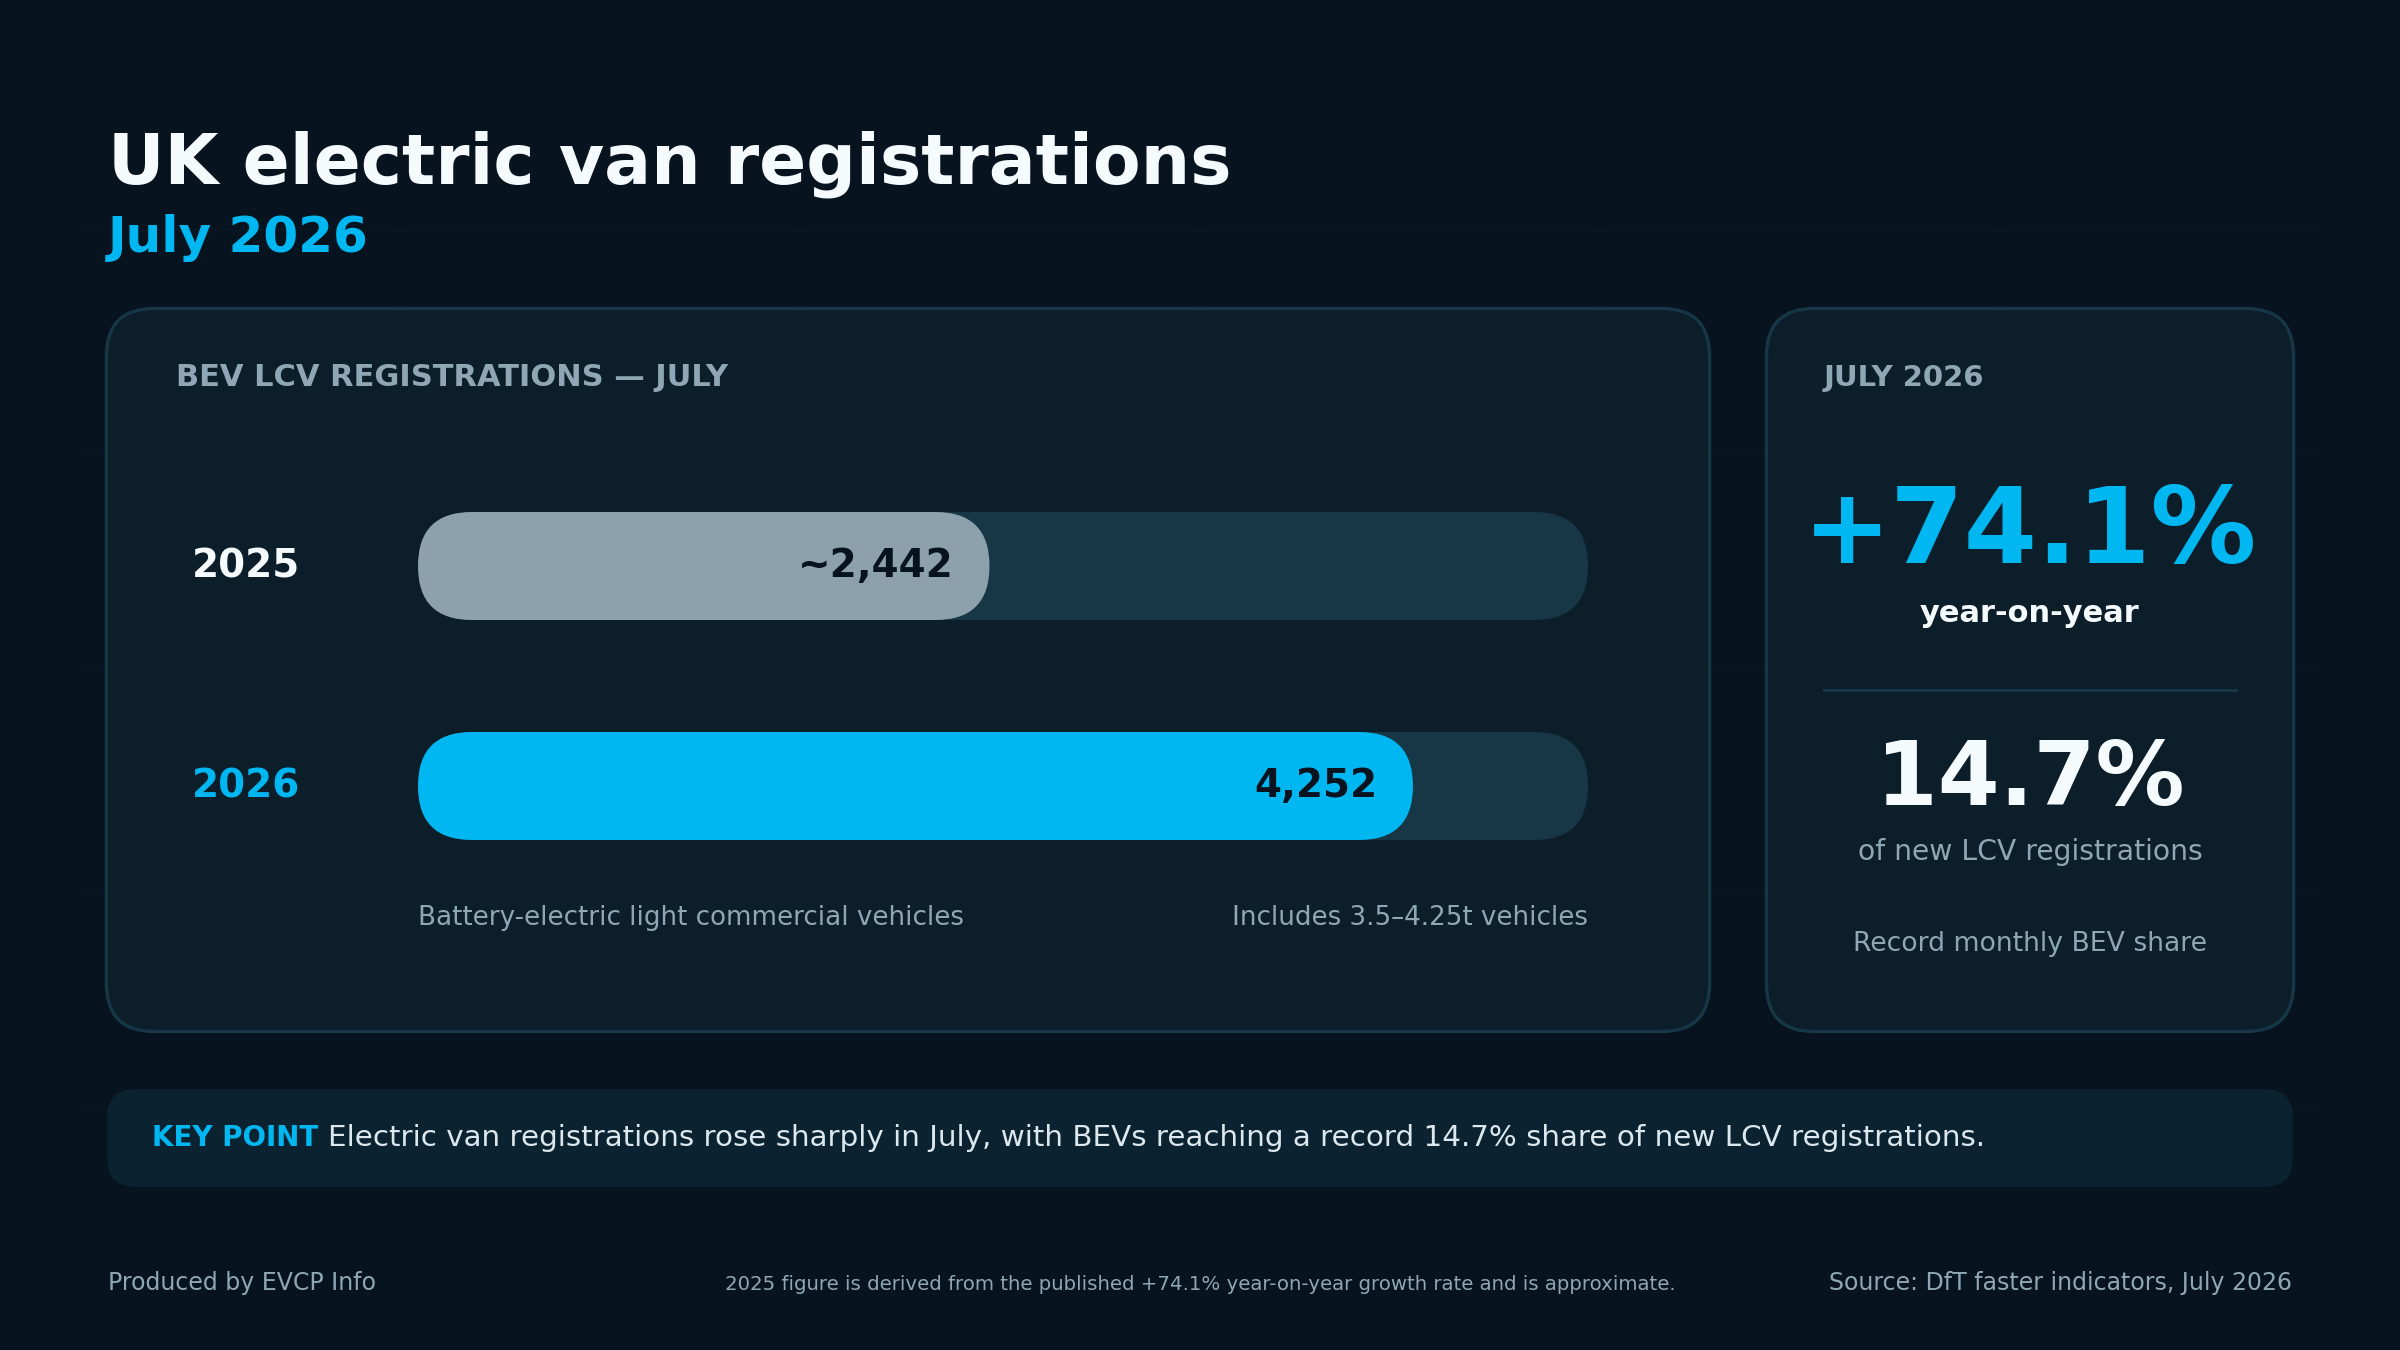
There were 3,994 BEVs below 3.5 tonnes registered during the month, up 83.4% from July 2025 and representing 13.9% of registrations in that category.
When the additional 3.5 to 4.25-tonne BEV category used in the regulatory LCV measure is included, battery-electric LCV registrations reached 4,252, up 74.1%, with a record 14.7% share.
The year-to-date position remains more modest. A total of 20,132 BEV LCVs have been registered under the wider measure so far in 2026, giving them a 10.6% share.
For the charging sector, this is worth watching closely. Vans create different infrastructure requirements from passenger cars. Depot charging, overnight load management, fleet back-office integration and reliable access to higher-power charging become increasingly important as electric vans move into wider fleet use.
July is therefore an encouraging month for electric vans, but the year-to-date figures show that adoption remains considerably behind the passenger-car market.
Vehicle growth and charger growth should not be treated as a direct race
It is tempting to put 28.7% year-to-date BEV registration growth next to 9.5% annual public charger growth and conclude that infrastructure is failing to keep pace. That comparison is too simple.
Vehicle registrations measure the flow of new vehicles entering the market. Charger growth measures the change in an already-established stock of public infrastructure. They are not equivalent growth rates.
Public charging is also only one part of the charging system. A large amount of charging takes place at homes and workplaces, while the demand placed on public infrastructure varies significantly depending on mileage, housing type, vehicle use and local charging availability.
The more useful conclusion is that the number of vehicles that may need access to charging continues to grow quickly, while the public network is also changing in composition. Higher-power infrastructure is growing faster than the total EVSE count, while lower-powered charging continues to serve residential and destination use cases.
What the figures tell us
The 122,724 public charger headline is useful, but it does not tell the whole story.
Nearly 43% of new cars registered in July could be plugged in. Rapid and ultra-rapid charging is growing faster than the public network overall. Electric van registrations are also showing stronger growth, although from a much smaller base than cars.
For installers, CPOs, manufacturers and specifiers, that means charger count is only one part of infrastructure planning. Power availability, location, dwell time, utilisation, simultaneous charging capability, load management and reliability all affect how useful a site will be.
A network can add a large number of lower-powered EVSE without increasing its available power by the same proportion. Equally, a relatively small number of high-power chargers can add significant capacity but may do little to address overnight or residential charging demand.
The latest DfT figures show that the UK public charging network is still expanding. More importantly, they show that the shape of the network is changing alongside the vehicles expected to use it.
Related articles
UK reaches 121,171 public EV chargers as rapid network grows faster
Department for Transport figures show the UK had 121,171 publicly available EV chargers, measured as EVSE, on 1 July 2026. Of these, 28,887 were…
UK rapid-charging tariff spread reaches roughly 39p-93p/kWh
UK rapid and ultra-rapid public charging prices now span roughly 39p/kWh to 93p/kWh across selected tariffs in Chargenet's 11 September comparison, illustrating how difficult…
US public DC fast charging cost averages published by DCFC Tracker
The average non-member price for public DC fast charging in the United States is currently $0.545 per kWh, according to DCFC Tracker's latest market…